The question of which is one we are asked frequently. However, you may be surprised to find out that there isn’t just one big Rotherham property market, but lots of small micro-property markets.
Recent data released by the Office of National Statistics (ONS) suggests that at least three of these micro-property markets have emerged over the last 20+ years in the town.
We have named them as follows:
- ‘lower’ Rotherham Property Market.
- ‘lower to middle’ Rotherham Property Market.
- ‘middle’ Rotherham Property Market.
You may be interested to know how we have classified the three sectors:
- ‘lower’ – the bottom 10% (in terms of value) of properties sold
- ‘lower to middle’ – lower Quartile (or lowest 25% in terms of value) of properties sold
- ‘middle’ – which is the median in terms of value
Who is buying in the ‘lower’ and ‘lower to middle’ sectors in Rotherham?
The ‘lower’ and ‘lower to middle’ sectors of the Rotherham property market have been fuelled over the last few years by two sets of buyers.
The first set make up the clear majority of those buyers – they are cash rich landlord investors who are throwing themselves into the Rotherham property market to take advantage of alluringly low prices and even lower interest rates. The other set of buyers are the first-time buyers (FTB), although the FTB market is in a state of unparalleled deadlock. This market has been trampled into near-immobility and incapacity by the new 2014 stricter mortgage affordability regulations and also fewer mortgages with low deposits.
How is each micro sector doing?
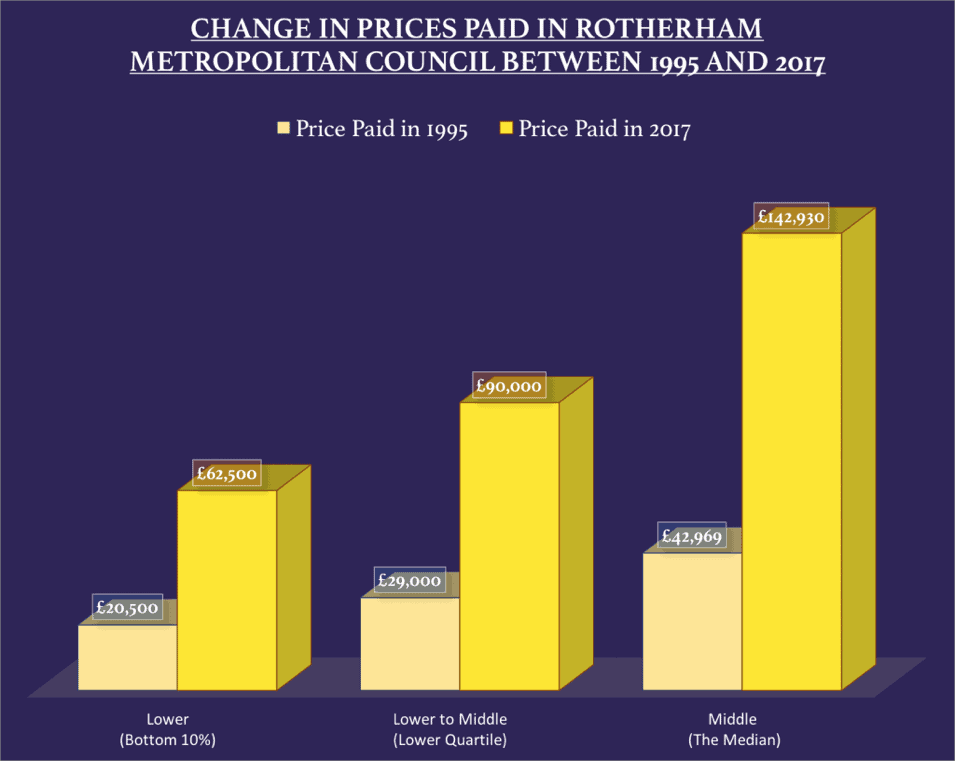
We’ve been examining the three different micro sectors that are identified below and the figures show that they have all performed quite differently:
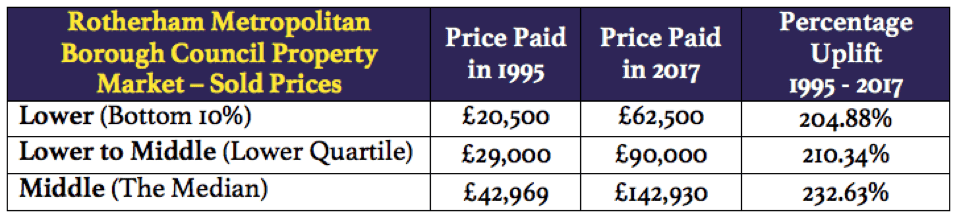
You can quite clearly see that it is the ‘middle’ market that has performed the best.
What do all these figures mean to homeowners and landlords?
There’s quite a lot of significance. The worst performing sector (with the lowest percentage uplift) was the ‘lower’ housing market. Therefore, if we applied the best percentage uplift figure (i.e. from the ‘middle’ market percentage uplift), to the ‘lower’ 1995 housing market figure, the 2017 figure of £62,500, would have been £68,189 instead. Which is a notable difference.
Why haven’t you mentioned the upper housing market in Rotherham?
Firstly, the lower or middle market is where most of the buy-to-let investment landlords buy their property and where the majority of property transactions take place.
Secondly, due to the unique and distinctive nature of Rotherham’s up-market property scene (because every property is different and they don’t tend to sell as often as the lower to middle market), it is much more difficult to calculate what changes have occurred to property prices in that part of the Rotherham property market – looking at the stats for the up-market Rotherham property market from Land Registry, only 9 properties in Rotherham (and a 3 mile radius around it) have sold for £1,000,000 or more since 1997.
How will this information help me?
Homeowners and buy-to-let landlords can benefit from this information. When you realise that there isn’t just one property market in our area, but several micro property markets, you can spot trends and bag yourself some potential bargains. Even in this market, we have spotted a number of great opportunities over the last few months, especially in the ‘lower’ and ‘lower/middle’ market.
To keep up to date with all our latest news and the buy-to-let bargains, why not follow us on Twitter or like our Facebook page.
If you are an investor or landlord that is interested in our services, please contact the office.