Check out our insider video to find out the latest stats in your area.
If you want your area covering, get in touch and we will endeavour to help.
Data provided by Dataloft and correct at time of filming.
Check out our insider video to find out the latest stats in your area.
If you want your area covering, get in touch and we will endeavour to help.
Data provided by Dataloft and correct at time of filming.
Check out our insider video to find out the latest stats in your area.
If you want your area covering, get in touch and we will endeavour to help.
Data provided by Dataloft and correct at time of filming.
Check out our insider video to find out the latest stats in your area.
If you want your area covering, get in touch and we will endeavour to help.
Data provided by Dataloft and correct at time of filming.
Zero Deposits – What are they?
What?? A Landlord doesn’t take a deposit from the Tenant?? Surely this can’t be right?? Well, not all is as it seems here, what I am talking about is something called a ‘Zero Deposit Option’ and the theory behind it is to give potential tenants more financial freedom whilst still providing the same protection for landlord’s who will accept a Zero Deposit as a traditional cash deposit does. Landlord’s can still claim against the Zero Deposit if terms of the tenancy agreement are broken in the same way as they do now. The Zero Deposit company would pay the landlord if the claim is upheld and then the Zero Deposit company would take up the costs with the tenant separately meaning the tenant still has a vested interest in looking after the property in the same way as they do now.
What’s the catch?
For the landlord the upside would appear two-fold. The first upside is that they are covered for all of the same things that a traditional cash deposit would cover in a tenancy agreement contract up to a value of 6 weeks contractual rent. The second upside is that it should help with a quicker rental of the property as more potential tenants would have the finances to take the property. More potential tenants should equate to smaller void periods between tenancies.
For the tenant there is a little more to consider, the upfront cost of moving into a property is reduced as they don’t have to find a large deposit sum (normally 5 weeks of the contracted rent) BUT instead they pay for a Zero Deposit policy. This is non-refundable so they do not get this money back at all but it is only going to cost 1 week of the contracted rent so a large sum of 4 weeks of rent doesn’t have to be found upfront. This is where careful consideration for the tenant has to come in.
Is this product right for them?
Yes, the tenant has less money to find upfront but there is a sum of money (1 weeks rent) that they definitely won’t get back whereas with a traditional cash deposit, if they meet all of the obligations under the tenancy agreement and hand the property back in the same condition as it was given, then they would normally receive all of their cash deposit back.
What are your thoughts Landlords? Call Bricknells to discuss the pros and cons to see if this works for you.
Donna and Mark had been trying to sell their house for 2 years with no luck. They owned half their house outright but wanted to move to a new home across the other side of town. They had little savings and felt really stuck. Steph suggested that they ‘capital raised’ the deposit, for the new house, out of there current homes equity and rented their house out to enable them to move! They were going to be hit with £12K Stamp duty as oppose to £6K if they sold, however she worked out that they would make the difference back in rental income in a year! The couple are set to move in May. If you can’t sell you house, and would like to turn it into an investment speak to us and we can help this dream become a reality!
Dave got made redundant two years ago and has had a pot of cash in his back pocket since. He was lucky to walk straight back into work at another place! Last year, he made £2.50 on his savings that were sat in his bank. He started looking at his options and found out that if he invested his redundancy money into a “Buy to let” he would make a profit of £325 per month! He is now the proud owner of two houses and the money he makes is used to pay off his own mortgage… 12 years early.

Section 21 Notice
Section 21 procedure if a tenant doesn’t vacate by the expiry date:
Not to be confused with a Section 8 Notice
Abandonment Notice
Your mind-set towards buying your first Rotherham buy-to-let property needs to be much different to your mind-set and tactics you employ when buying a home for yourself to live in.
The main difference is when purchasing your own property, you may well pay a little more to get the home you (and your family) want, and are less likely to compromise. When buying for your own use, it is only human nature you will want the best, so that quite often it is at the top end of your budget.
However, with a buy-to-let property, if your goal is a higher rental return you must be aware that a higher price doesn’t always equate to higher monthly returns – in fact quite the opposite. Instead, inexpensive Rotherham properties can bring in bigger monthly returns.
Most landlords use the phrase ‘yield’ instead of monthly return. To calculate the yield on a buy-to-let property take the monthly rent, multiply it by 12 to get the annual rent and then divide it by the value of the property.
As a result, if the price of a property is more, the yield will drop. Meaning, if a buy-to-let landlord here in Rotherham has to decide between two properties that will generate the same monthly rent, the landlord can increase their rental yield by selecting the lower priced property.
What is the average yield for Rotherham properties?
The below graph can give you an idea of the sort of returns in Rotherham.
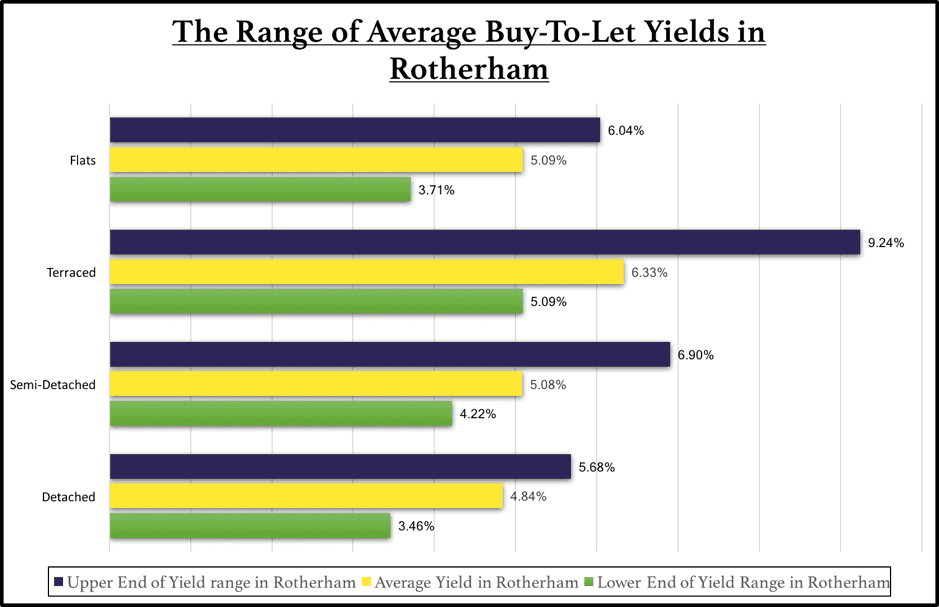
Now of course these are averages and there will always be properties outside the lower and upper ranges in yields… however, they are a fair representation of the gross yields you can expect in the Rotherham area.
As we move forward, with the total amount of buy-to-let mortgages amounting to £199,310,614,000 in the country, landlords need to be aware of the investment performance of their property, especially in the era of tax increases and tax relief reductions. Landlords are looking to maximise their yield – and are doing so by buying cheaper properties.
Other factors can impact your choice of buy-to-let property
However, before everyone in Rotherham starts selling their upmarket properties and buying cheap ones, yield isn’t the only factor when deciding on what Rotherham buy-to-let property to buy.
Void periods (i.e. the time when there isn’t a tenant in the property between tenancies) are an important factor and those properties at the cheaper end of the rental spectrum can suffer higher void periods too. Apartments can also have service charges and ground rents that aren’t accounted for in these gross yields.
Another way landlords can make money is if the value of the property goes up. Therefore, for those Rotherham landlords who are looking for capital growth, an altered investment strategy may be required.
In Rotherham, for example, over the last 20 years, this is how the average price paid for the four different types of Rotherham property have changed…
It is a balancing act
When buying in Rotherham, it is very much a balancing act of yield, capital growth and void periods.
To keep up to date with all our latest news and the buy-to-let bargains, why not follow us on Twitter or like our Facebook page.
If you are an investor or landlord that is interested in our services, please don’t hesitate to contact the office on 01709 365 584.
Did you know? In Rotherham, there is a 25.3% drop in people that are moving home in the last 10 Years.
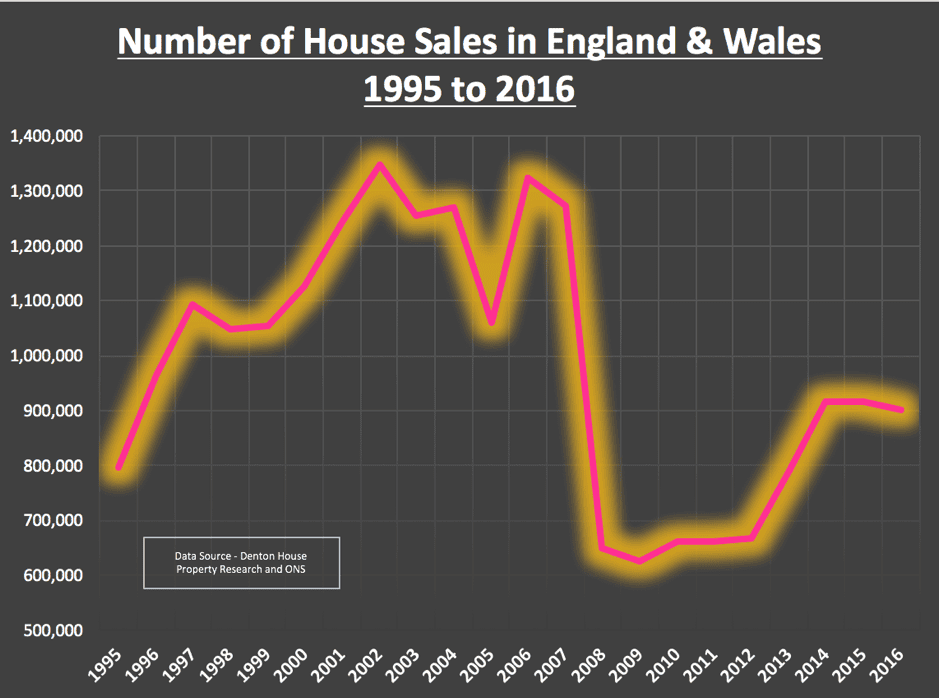
Back in the early 2000s between 1m and 1.3m people moved each year in England and Wales, peaking at 1,349,306 home-moves (i.e. house sales) in 2002. However, after the ‘credit crunch’ hit in 2007 the number of house sales fell to 624,994 in 2009.
Since then it has steadily recovered, albeit to a more ‘respectable’ 899,708 properties by 2016. This means there are around 450,000 fewer house sales (house-moves) each year compared to the previous decade.
So, why are there fewer house sales?
To answer this question, we need to go back 40/50 years.
Inflation was high in the late 1960s, 70s and early 80s. To combat this the Government raised set interest rates to a high level in a bid high to try to lower inflation. Higher interest rates meant the householders monthly mortgage payments were higher, meaning mortgages took a large proportion of the homeowner’s household budget. Despite this, it wasn’t all bad news as the high inflation eroded the mortgage debt in ‘real spending power terms’. As wages grew (to keep up with inflation), home owners could get bigger and even higher mortgages. This therefore allowed people to move up the property ladder more quickly.
Things changed in the late 1990s and early 2000s.
UK interest rates tumbled as UK inflation dropped. Lower interest rates and low inflation, especially in the five years 2000 to 2005, meant we saw double digit growth in the value of UK property. This inevitably meant all the home owner’s equity grew significantly, meaning people could continue to move up the property ladder (even without the effects of inflation).
This snowball effect of significant numbers moving house, continued into the 2000s (2004 to 2007), as banks loosened their lending criteria where home movers could borrow even more to move up the property ladder.
How have things changed in 2017?
You would think that with ultra-low interest rates at 0.25% that the number of people moving would be very high. However, this has not been the case. Less people are moving due to:
What does this mean for Rotherham?
In 2007, 4,821 properties sold in the area but by last year (2016) only 3,598 properties sold. This is a drop of 25.37%.
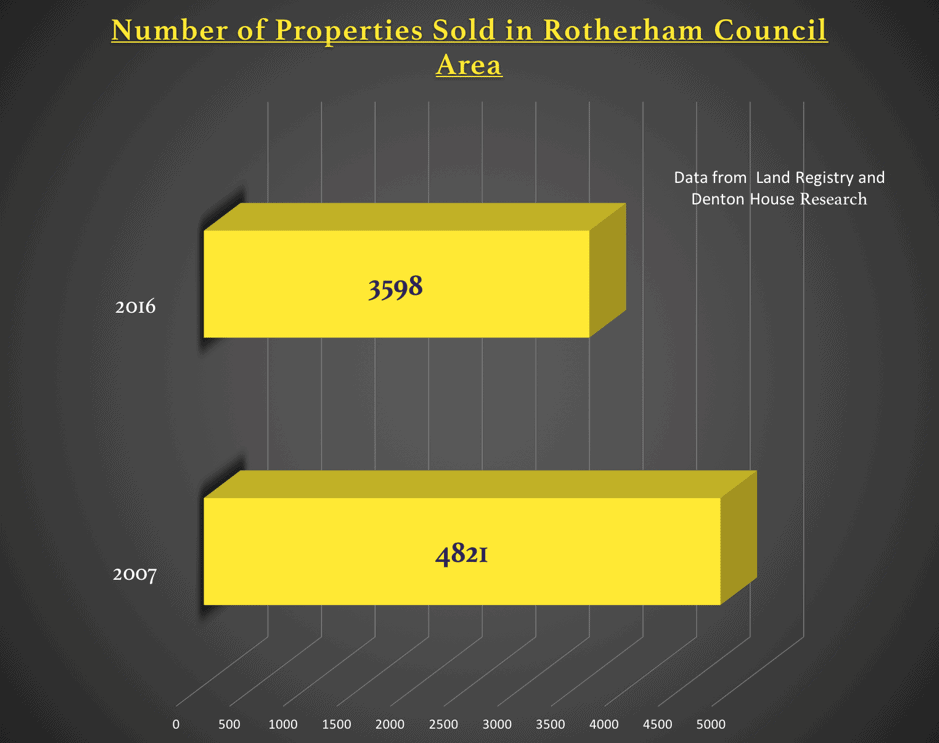
Therefore, we have just over 1,220 less households moving in the Rotherham and the surrounding council area each year.
Now of that number, it is recognised throughout the property industry around 80% of them are homeowners with a mortgage. That means there are around 1,003 mortgaged households a year (80% of the figure of 1,220) in the Rotherham and surrounding council area that would have moved 10 years ago, but won’t this year.
The reason they can’t/won’t move can be split down into different categories, explained in a recent report by the Council of Mortgage Lenders (CML). So, based on this report, of those estimated 1,003 annual Rotherham non-movers:
So, what can we do about it?
Without doubt, the first three points above (lifestyle, demographics and high price growth) is something beyond the Government or Bank of England control.
Having said this, there could be some influence exerted to help the people that are unable to move because of the financing of the new mortgage or having to keep within the new rules of mortgage affordability.
If the Rotherham property values were lower, this would decrease the size of each step up the property ladder. This would mean the opportunity cost of increasing their mortgage would reduce and they would be able to move to more upmarket properties.
To keep up to date with all our latest news, why not follow us on Twitter or like our Facebook page.
If you are an investor or landlord that is interested in our services, please don’t hesitate to contact the office on 01709 365 584.
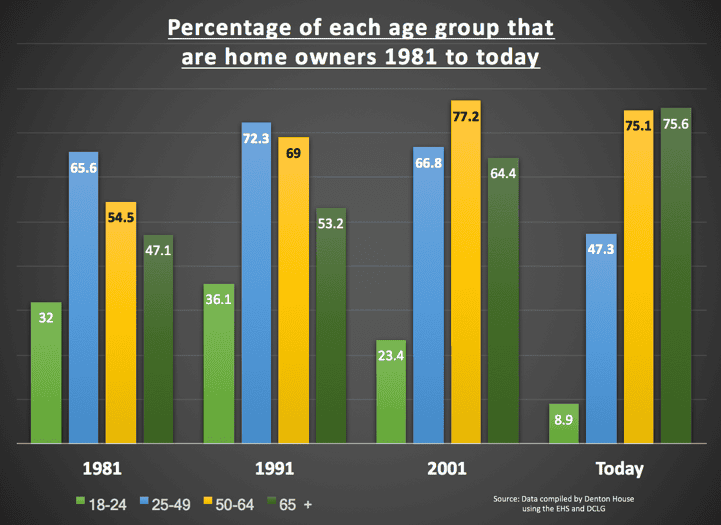
Looking at the UK as a whole, this graph shows the percentage of each age group that are homeowners from 1981 to today.
Over 75 percent of Brits aged 65 and above are owner-occupiers, the biggest share since records began and a proportional rise of over 48.3% since the early 1980s. Looking at that age bracket and roll the clock back 36 years (to when they were in their 30s and 40s) and two thirds (65.6%) of them owned their own home.
However, today just under half of 25 to 49 year olds (47.3%) own their own home. Plus, the biggest drop has been in the 18 to 24-year old’s, where homeownership has dropped from a third (32%) in the 1980s to less than one in ten (8.9%) today.
Looking at the Rotherham statistics, the numbers make more interesting reading:
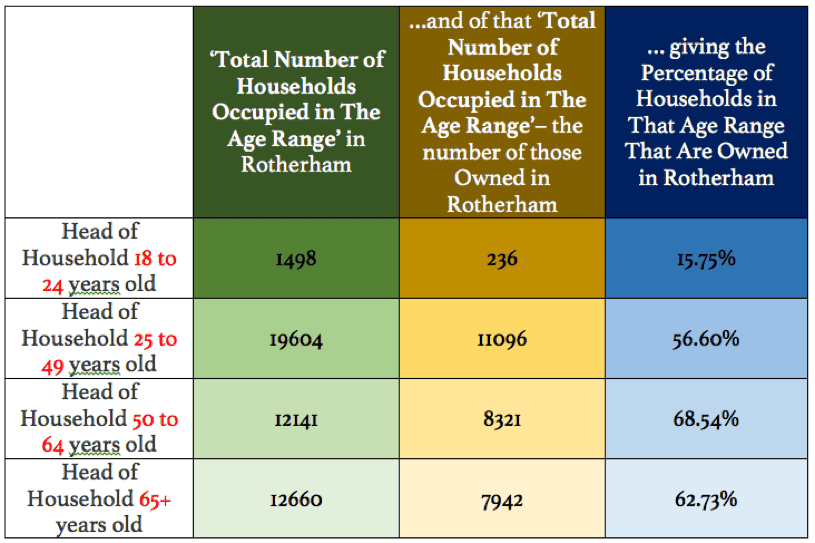
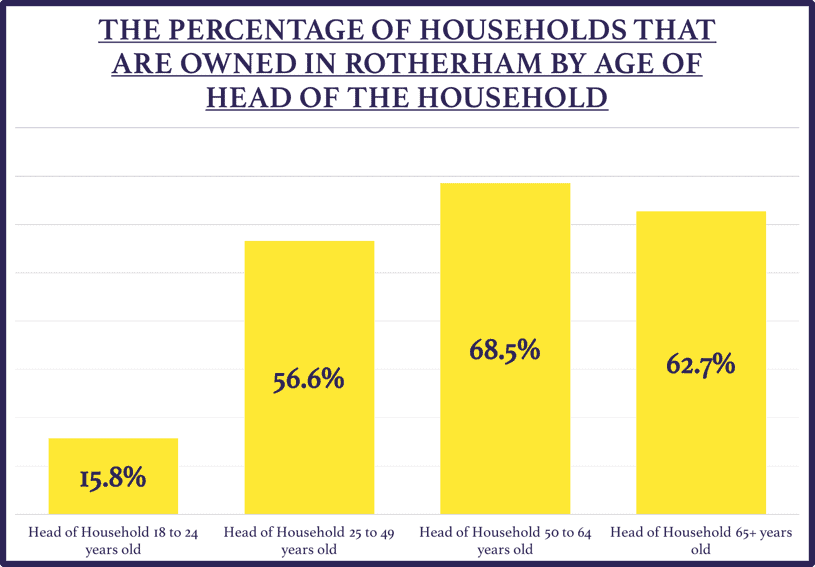
18 to 24 year olds are still significantly less likely to own a house compared to the older generations.
Government policy contributes to the generational stalemate.
Stamp Duty rules prevent older Brits from moving as the price of land and planning rules make it harder to build affordable bungalows that are attractive to members of the older generation who want to move.
The average value of an acre of prime building land in the UK is between £750,000 and £800,000 per acre.
Bungalows are the favoured option for the older generation, but the problem is bungalows take up too much land to make them profitable for new homes builders. The housing market is gridlocked with youngsters wanting to get on (then move up) the property ladder whilst the older generation, who want to move from their larger houses to smaller, more modern bungalows, can’t.
One solution could be to start to talk to your local councillors, so they can mould the planners’ thoughts and the local authority thinking in setting land aside for bungalows instead of two up two down starter homes? That would free the impasse at the top of the property ladder (i.e. mature people living in big houses but unable to move anywhere), releasing the middle aged gridlocked people in the ladder to move up, thus releasing more existing starter homes for the younger generation.
To keep up to date with all our latest news, why not follow us on Twitter or like our Facebook page.
If you are an investor or landlord that is interested in our services, please don’t hesitate to contact the office on 01709 365 584.
The latest government figures show that ‘real pay’ has dropped 1% in the last six months and from talking to several landlords in the area, they are very conscious of the capacity and ability of their tenants to pay the rent versus their own need to raise rents on their rental properties.
However, the evidence does suggest many landlords feel more assured now than they were a few months ago about pursuing higher rents on their properties.
One of the reasons may be due to the summer months – historic evidence suggests that the rents new tenants have had to pay once they’ve moved in have increased during the summer. This is because, June to August is a time when renters like to move, which means that demand surges and tenants are usually prepared to pay more to secure the property in the place they want to be.
This is particularly good news for Rotherham landlords as average Rotherham rents have been on a downward trend recently.
Take a look at the figures:
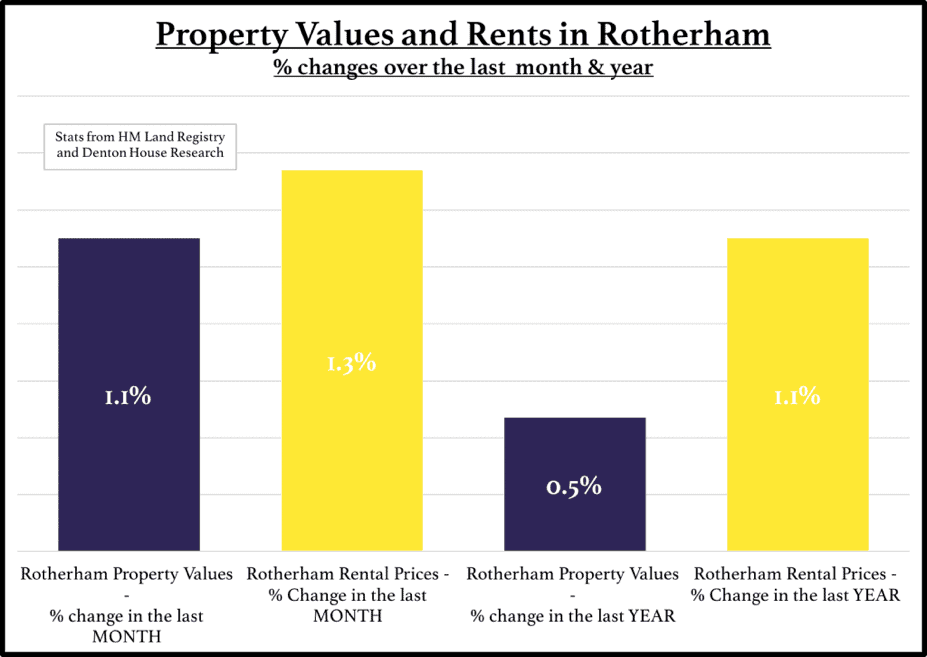
Rents in Rotherham on average for new tenants moving in have risen 1.6% for the month, taking overall annual Rotherham rents 1.1% higher for the year
Several Rotherham landlords have expressed their apprehensions about a slowing of the housing market in Rotherham.
On the other hand, property investing is capital values (which will also be of interest to all the homeowners in Rotherham as well as the Rotherham buy-to-let landlords).
According to the Land Registry…
Property Values in Rotherham are 0.47% higher than they were 12 months ago.
However, they’ve actually risen by 1.34% last month.
The reality is the number of properties that are on the market in Rotherham today has dropped by 8.05% since the turn of the year – this fact will have an interesting effect on short-term Rotherham property values. As tenants have had less choice, buyers now have less choice.
Are you selling? Realistically price your property
Whether you are a homeowner or landlord, if you are planning to sell your Rotherham property in the short-term, it is crucial that whilst you allow room for negotiation, you must still realistically price your property when you bring it to the market.
Given that everyone now has access to property details, including historic stats for how much property has sold for, buyers will be more astute during the offer and negotiation stages of a purchase.
Property prices will remain strong medium to long-term
Even with this short-term decrease in the number of properties for sale in Rotherham, property prices will remain stable and strong in the medium to long-term. This is because the number of properties on the market today is still way below the peak of summer of 2008 when there were 1,260 properties for sale compared to the current level of 765 (if you recall, prices dropped by nearly 20% in Credit Crunch years of ‘08 and ‘09).
Compared to 2008, today’s lower supply of Rotherham properties for sale will keep prices relatively high… and they will continue to stay at these levels for the medium to long-term.
Fewer people are moving than a few years ago, meaning less property is for sale. Fewer properties for sale mean property prices remain relatively high and this is because of a number of underlying reasons:
If you are a Rotherham homeowner, that isn’t planning to sell – this talk of price changes is only on paper profit or loss. However, if you are planning to sell, most people that sell are buyers as well, so even though you might not get as much for your house, the one you want to buy shouldn’t be as much either. Swings and roundabouts! If you are a Rotherham landlord, make sure you keep your eyes peeled, as there may be some decent buy-to-let deals to be had in the next few months.
To keep up to date with all our latest news and the buy-to-let bargains, why not follow us on Twitter or like our Facebook page.
If you are an investor or landlord that is interested in our services, please don’t hesitate to contact the office on 01709 365 584.